Hosting Football Manager 2018 On Linux
Yes, that’s right. I don’t get to analytics in public much these days, so I’m bringing you analytics-adjacent content, because I broke down this weekend and bought Football Manager 2018 (twice, read on). And this, despite being overlooked for inclusion in the database for another year despite all those SciSports guys getting in.
Whatever.
So Football (née Championship) Manager was obviously a big part of my youth, like the rest of you. One of the things that I realised upon becoming a proper grown up with a job and everything is that toys are actually really cheap. Like, you get £10 pocket money a week to spend on Optimus Prime or Mask toys, but then suddenly you’re getting all these extra zeroes and fuck it, you can just buy a WHOLE SHELF in Toys R Us (but then you have kids and realise that all these toys have to be put away and every day you tread on lego and it’s a nightmare). And so it is with computers – I remember running CM97/98 on my Pentium II 266MHz with 64MB RAM and being entirely happy.
But then, dear reader, I became a professional proper data science football analytics thingy, and if there’s one thing we have, it’s CPU cycles to burn. So this weekend I installed Football Manager 2018 on a 24 core Xeon server with 128GB RAM BECAUSE I CAN THAT’S WHY.
From the beginning, I have always run Football Manager at maximum detail. I need to be able to watch U23 games in Guatemala in full detail. I need the option of rebuilding my career in the Finnish 2nd division. I am after ABSOLUTE REALISM here. And so I want to run FM18 with its full complement of 350k players and 115 leagues in maximum detail without my laptop incinerating my manparts (FYI we’ve got our 3rd and FINAL child on the way, so it’s really just the pain, not a fertility thing).
Requirements
You will need:
- A computer you want to use as a server. To be honest, FM doesn’t seem to use tons of RAM so I expect even 16GB is fine even if you do the RAMDISK shenanigans later. More cores is better though.
- If you’re using an actual server, a VNC client to talk to it.
- Probably two Steam accounts (if you don’t want to play over VNC)
Setup
The basic process is this:
- Get a server
- Install Steam
- Set up VNC
- Create a game
- Connect to the game from your own PC
- Go on holiday on the server
- Abandon all human relationships
Server Configuration
Unfortunately there’s no way to just run an FM server process as a daemon, you need a proper desktop environment and Steam etc. My server’s an Online.net Dedibox, but you might be able to do this on AWS or whatever hardware you have running around. As far as I can tell, Steam only really has two requirements on Linux:
- XRandR support (to detect monitor dimensions)
- 24bpp colour (which seems arbitrary)
Unfortunately, the first of these means you can’t use Xrdp, which was my first attempt. RDP is a bit more efficient than VNC but ultimately you’re not going to be using the server interactively that much so it doesn’t matter.
Instead, I used x11vnc, which directly serves your X server’s output over VNC. It supports XRandR because it’s really just replicating your server’s local X setup. Maybe, I dunno, it works though.
$ sudo apt install x11vnc lightdm xfce4-desktop
That’ll give you a minimal X11 setup. It’s Linux though, so it probably won’t work. But if you’re lucky, LightDM starts. You’ll want to set a password for VNC first, with:
$ sudo x11vnc -storepasswd
That’ll prompt you for a password to use when you connect to the server with a VNC client later. After that, you can run x11vnc to listen to connections thusly:
$ sudo x11vnc -ncache 10 -ncache_cr -xkb -noxrecord -noxfixes -noxdamage -display :0 -auth /var/run/lightdm/root/:0 -usepw
You probably shouldn’t do this as root, but whatever, live a little. If you’re extremely lucky, you’ll now be able to connect to your machine via VNC over an SSH tunnel. You can now browse to the steam site and grab the DPKG file they offer to Linux clients, and:
$ sudo dpkg -i steam_latest.deb
Again, if you’re lucky, you’ll now just be able to run Steam, either by its menu entry, or at the command line. Me, I had to monkey a bit with my /etc/xorg.conf like it was 1997. Here’s my setup, on a machine with an old Matrox G200 card. You can configure the monitor/modeline settings for your own machine, here I’m just connecting with a crappy old netbook:
Section "Device"
	Identifier "Matrox G200"
	Driver "mga"
	Option "UseFBDev" "On"
	Option "ShadowFB" "On"
EndSection

Section "Monitor"
	Identifier "Netbook Monitor"
	Modeline "1366x768" 60.0 1366 1404 1426 1494 768 772 778 788 -HSync -Vsync
EndSection

Section "Screen"
	Identifier "24-bit Depth Screen"
	Monitor "Netbook Monitor"
	Device "Matrox G200"
	DefaultDepth 24
	SubSection "Display"
		Depth 24
		Modes "1366x768"
	EndSubSection
EndSection
The most important thing here is ensuring you’re using 24 (or 32) bit colour. Even though you don’t actually care about display quality on the server, Steam won’t run with 16bpp colour.
One other thing to notice is UseFBDev and ShadowFB – instead of actually setting up your card for DRI and stuff, writing to a framebuffer results in the best possible VNC performance, because ultimately all x11vnc wants to do is copy the contents of your framebuffer and send it over VNC.
Okay, if all this worked, you can run Steam, purchase/install FM18 and then launch it. If not, well, 2019 is the year of the Linux desktop, so maybe wait until then.
Network Game Setup
Once you’re running FM over VNC, create a new network game. TICK ALL THE BOXES TO MAKE IT RUN AS SLOW AS POSSIBLE. Once it’s up and running, you should be able to connect from another machine. Because Richard Stallman makes people uncomfortable, we live in an age where you have to purchase two copies of FM18 to run it on two machines at once, so I did this. Then, you can connect to your network game and add a manager. Once that’s done, go to the server game and send your manager on holiday indefinitely. At this point, your remote FM connection has basically complete control of the game, but with all the resources of the server, so things run fast and your fans don’t go bonkers.
Additional Optimisations
If you want to experiment further, you can move FM’s temporary files to a RAMDISK. Linux generally does a good job of caching filesystem writes, but personally I’ve copied the following to /dev/shm for maximum performance:
~/.local/share/Sports\ Interactive/Football\ Manager\ 2018/Caches~/.local/share/Sports\ Interactive/Football\ Manager\ 2018/Temporary~/.steam/steamapps/common/Football\ Manager\ 2018/data
Symlink them from their original locations, and FM is basically running everything within RAM.
Conclusion
This is how I spent my weekend, anyway. Your mileage may vary. Of course, I don’t now have time to spend playing the actual game, but it’s nice to know it’s up there waiting for me over Christmas. If you fancy joining in the slowest game of Football Manager 2018 in the world, DM me on Twitter for the server details. The game runs at a rate of about a month of game time per real evening.
500 Days of Numbers
I checked today on a whim, and was a little freaked out that it’s exactly 500 days since the first post on this site. That post was a bad joke, foreshadowing much of the work that was to appear on this site, but I thought I might have some leeway to indulge and [record scratch, freeze frame] talk about how I got here.
Out of Gas
In 2015 I found myself utterly burnt out. I’d learned programming at the age of six or seven, and it was something I loved and eventually made a career out of. Lately I’d founded a couple of startups, I even got to pitch at Downing Street one time, but between the exhausting schedules, the disappointments and the guilt of letting down investors and employees alike, I’d arrive at the point where I resented sitting and feeding the machine day after day. No child first stares up at a computer monitor hoping to one day make enterprise middleware. Yet here I was at 35, slightly confused at what had happened in the intervening years.
Instead of packing it all in and making wicker furniture for the rest of my life, I looked around for a hobby to salvage something of the only skill I really had. I toyed with the idea of making games, but I don’t really have the talent. Instead I settled on these here football stats. As I’ve told elsewhere, I was only really aware of football analytics because I followed Ted Knutson back when he wrote about Magic: the Gathering. Eventually StatsBomb happened and I was hooked. In October 2015 I grabbed some data and jumped in.
Shindig
Not a lot of people know this, but there’s a reason this blog has such a silly name. I applied for the 2016 Opta Pro Forum with a deep learning model that would basically [redacted] and [redacted], allowing you to measure [redacted] for any [redacted]. It got rejected, of course, but I was lucky enough to get an invite to the shindig itself and meet many of you for the first time, and ramble long into the night about numbers and hypothetical Netherlands lineups for Euro 2016. I’m grateful I got rejected in a way, because instead of spending that period doing something, y’know, hard, I could spend months just playing with the data. To this day I think this is something we don’t do enough of. Just take the data and cut it in fifty different ways and see how it looks, see what’s possible.
Trash
This approach of playing with data explains pretty much all the work I’ve done in public. What do attacks look like? What does defending look like? All these things derive from mucking about. It’s all entirely well-intentioned, but likely has no analytical value at all. We seem to struggle regularly as a community with this balance between people finding their feet and those expecting fully-fledged science. I feel like my work (and some of the stuff I’ve seen from, for example, David Sumpter), is as much about saying “hey! Look at what you can do with some freakin’ polygons!” as it is about making hard statements of fact. I like to think that some of my work is approachable, and possibly even salvageable for someone to built something cool upon, but I’ll admit that every year Sloan comes around I spend a week in despair that I ever presumed I had anything to offer the field of football analytics. As I pointed out in the last State of the Stats, we’re all vaguely in competition with each other so it’s hard, but to everyone out there experiencing their bout of impostor syndrome, I see you, you’re doing cool stuff!
War Stories
Impostor syndrome in mind, here’s a list of nice things that have happened to me in and around football:
- Bobby Gardiner was my first every follower, which is nice because I still regularly chat to him and enjoy his work.
- The Challengers Podcast was the first thing to invite me on to ramble, and you should subscribe to them because they put out an absurd amount of content on a regular schedule.
- I got to contribute to StatsBomb and I still feel guilty to this day when I put stuff on here while James works his arse off rustling up new work.
- I repeated myself ramble-for-ramble on the Analytics FC podcast but with added puns.
- I talked to my first Premier League club and utterly failed to convince them to give me a job.
- A very nice and extremely patient guy called Jakub Dobias got in touch with me because he was trying to convince Slavia Prague to use analytics.
- Our first signing (to a tiny degree based on PATCH) went on to win the African Cup of Nations and we don’t really get to take much credit for his incredibly hard work but I am incredibly smug about it as everyone I’ve boasted to knows.
- I’m getting to travel to Copenhagen to judge a really cool hackathon!
- I have a full time job in football analytics!
The Train Job
It felt sad when stats poster-boys Brentford/Midtjylland’s ruling boffins SmartOdds disbanded their football analytics department. But it paid off for me when Ted got the itch to get back into the game and started Statsbomb Services. I’ve been responsible for putting together some dead simple tools for clubs to do smart stuff: you’ll be familiar with Ted’s radars, but also stuff like the shot charts and passing maps we can generate at the touch of a button. There’s a lot of clever stuff in the pipeline for the next few months, much of which I expect will end up causing aggro in Ted’s mentions on Twitter, which is the measure of any good analytics work.
Objects in Space
So, that’s where I have managed to get in my brief time in football analytics. Given that it’s just been both the Opta Pro Forum and the Sloan Sports Analytics Conference in the last six weeks, I thought I’d talk a little bit about the future, and given that football’s just objects in space, where we might be headed with tracking data:
- My overall attitude to analytics in 2017 is the same as the old William Gibson quote: the future is already here — it’s just not very evenly distributed. US sports (within teams or in partnership with academia) are doing amazing work. It’s very likely that there are football clubs (and certainly betting syndicates) running silent with similarly incredible work, absolutely head and shoulders above what we see in public. Then there are clubs who have some solid spreadsheets to avoid obvious mistakes, followed by vast swathes of clubs doing everything as they already have. Some of the latter have good enough coaches and scouts that it doesn’t matter much at the moment.
- Foundational problems such as how to correctly feed tracking data into neural network models are largely unsolved. I think this is where most of the interesting work is happening. At the same time I’d be surprised if any of it was truly digestible inside clubs. There will always be a tension between big, smart, opaque models and small, simple, transparent metrics.
- It is dumb that data is still an issue in football. Not just event data but tracking stuff too. My hope is that some of the nascent work turning broadcast quality footage into tracking data with machine learning will one day fundamentally alter the economics of the football data market, because it doesn’t seem like any of the leagues or football associates are going to.
The Message
I’m not gonna lie, at this point this is excruciatingly self-indulgent and I’m just stringing it out so I can reference more Firefly episodes, but the real message here is: I have got everything I could have hoped for out of football analytics, and you can too. It’s a genuinely fun, creative way to use my meagre programming skills, it’s a community of smart and often hilarious people, and it’s apparently even possible to pay your rent doing numbers. The feeling of watching tens of thousands of people, or indeed an entire nation, cheering on someone you had even a small part in moving from one club to another, from one country to another, is utterly thrilling. It’s been the most exciting 500 days in my life, and this is coming from someone that watched Oxford United win the Milk Cup in 1986, the same year I first started mashing the keyboard dreaming of one day making something cool.
Time-to-Shot from Goal Kicks & Throw Ins
A while back, I talked about a simple, flexible metric called Time-to-Shot:
TTS looks at a particular game state and simply calculates the time – in seconds – until the team in possession makes a shot (Time To Shot For, or TTSF) and the time until their opponents make a shot (Time To Shot Against, or TTSA). The lower this time, the more dangerous the situation for one team or the other, the higher the time, the safer.
I was uncomfortable about it then, and to an extent I still am, it certainly doesn’t have that New Analytics smell we’ve all come to expect. But as long as you don’t treat it as a source of absolute truth, and just a tool to give you a rough glance at tactical trends, teams and players, it’s an absolutely wonderful time-saver. So, I thought I’d show a couple more quick examples of ways to use it in anger.
Goal Kicks
Jared Young wrote a great piece on Analysis Evolved recently about goal kicks, pointing out that long goal kicks past the halfway line have negative expected value, and shorter kicks have positive EV. Jared does this by looking at the probability of scoring from the second or third possessions after the initial challenge for the ball from a goal kick to see what happens next. And what happens next is exactly TTS’s wheelhouse, let’s see if we can confirm his result.
This is a chart of the average TTSA minus TTSF (TTSD, as I like to call it) in various zones of the pitch when a goal kick is aimed there, taken from the big 5 European leagues from 2010/11 onward:
| 46 | 33 | -39 | -51 | -44 | -13 |
| 77 | 61 | -1 | -41 | -27 | -67 |
| 81 | 3 | -39 | -23 | -19 | |
| -6 | 65 | -6 | -44 | -38 | 5 |
| 21 | 48 | -30 | -54 | -22 | 61 |
The first two-thirds of your half, as you can see, are positive values – you’re closer to a shot for than against. Most of the rest of the field is negative – putting the ball there means, on average, your opponent is going to get a shot away first. You should note that some of these buckets get quite small – the area around your own goal, obviously, as there’s only a tiny sliver of space in front of the box to pass to in that zone, and the very furthest zones (but by all means experiment trying to get it to that top-right corner). But that caveat aside, we can quickly check a result, and delve deeper with other metrics if we want to follow up.
Throw-ins
We can perform the same sort of calculation for anything we like, for example: where should you be aiming our throw-ins? These charts show throw-ins from various parts of the pitch (marked with a dotted border), with average TTSD values in each zone with more than 50 throws in the dataset:
| 0 | |||||
| -9 | 69 | 123 | |||
| 66 | 70 | 28 | -4 | 79 | |
| 61 | 11 | -33 | -36 | -3 |
| 82 | 103 | 217 | -32 | ||
| 136 | 105 | 77 | 33 | -17 | -72 |
| 98 | 57 | 28 | -16 | 24 | 17 |
| 115 | 116 | 107 | 27 | ||
| 56 | 94 | 84 | 75 | 88 | |
| 25 | 75 | 47 | 25 | 33 |
| 105 | 251 | 121 | |||
| 144 | 111 | 92 | 92 | ||
| 80 | 111 | 82 | 63 |
What does this show? Long throws aren’t just a attacking routine you should be working on near the box, they actually seem to be a reasonable default. In basically every case, teams are better off (i.e. closer to their own shot or further away from an opponent’s shot) if they forget about progressing the ball down the wing off a throw in, and instead focus on getting the ball into the centre of the pitch.
Now, once again: TTS is just a bunch of numbers munged together as averages, and the zones above are pretty broad. You’re not going to take these numbers straight to the training pitch. But I do think it’s simple and flexible enough that we’ve quickly found something intriguing, and this result merits a deeper look into the data at some point. I will work on that soon, and see if we can confirm that the inferences we get out of TTS very quickly can be backed up more rigorously.
State of the Stats 2016 Results
Over the past couple of weeks, the 2016 State of the Stats survey gathered responses from more than 200 people involved in football analytics, either professionally or as a fan. This is the second year I’ve run the survey, and like last year, it’s about who we are as a community, our hopes and dreams, and the problems we face in our work. My hope is that it provides inspiration, tempers expectations, and exposes issues and opportunities for the coming year. At the very least, it’s got some big-ass pie charts in it, and that’s about as analytics as you can get, as I right?
Who Are We?
Affiliations
First up, it’s great to see that nearly half the people filling out the survey don’t necessarily identify as stats-first people:
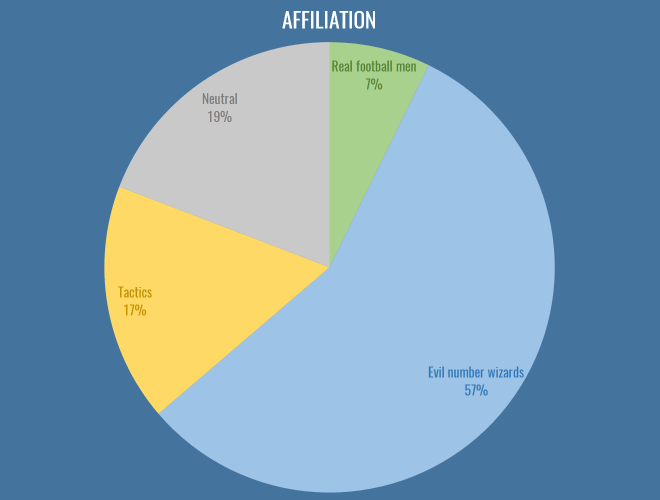
The first major issue I’d like to address here is that tactics people need to choose an appropriate epithet to describe them, along with ‘evil number wizards’ and ‘real football men’. I propose ‘The Pep Squad’, but I’m open to ideas. Nevertheless, this year has seen an interesting combination of cross-pollination and beef across the dividing lines of stats and tactics. Real football men hate laptops and Pep equally, so in a way provide us with some common ground, and the ascendancy of RB Leipzig has been a major driver in this regard: finally tactics and analytics people are united behind the common cause of destroying footballing traditions. Of course, stats people were trying to sign Naby Keita two years before you’d even created your first WordPress draft profiling him, but I wouldn’t know anything about that.
It is still the case that most analytics people view tactics writing as riddled with confirmation bias and small sample sizes, and tactics people view analytics people as missing almost everything interesting about football (e.g. basically every aspect of positional play, which is absolutely true). I maintain that the tactics community on Twitter and in the blogosphere is the single most unexploited resource for statsfolk. You have a group of smart people with fantastic intuition, who can help guide you to footballing truths and interesting patterns, and in return you can help add rigour and context to those intuitions. As an amateur analytics writer, you’re not going to get a better proxy for a manager or coach to drive your work. I hope to see more collaborations between the communities in 2017.
Ages
Once again, I neglected add in a question about the gender makeup of the analytics community, because I’m an arsehole, especially given this was pointed out last year. We go again. What we do have again this year is the age composition both inside and outside clubs:
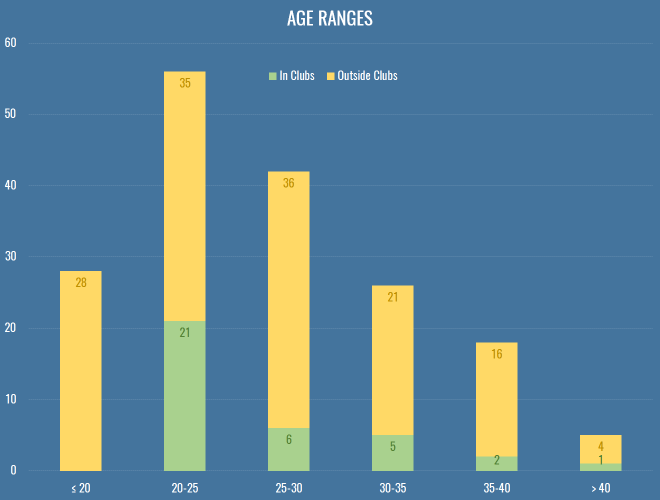
This is still very much skewed to the left, even more so for people at clubs or working as consultants. Without wanting to sound patronizing to my younger compatriots, a lot of this is that clubs have horrible pay structures (for all sorts of back room staff, forget about just stats). If you look at any of the analytics positions that get advertised publicly, you can sort of understand what someone with a mortgage and kids might not want to work the equivalent of two jobs for £20k, just because IT’S FOOTBALL! and IT’S A DREAM JOB! I was heartened to hear that the magnificent Christopher Long is soon to be entrusted with building the analytics team at an English club, and has stressed that he’s looking to pay market rate for technical positions. Hopefully that’s a sign of things to come.
Education
This is how we look in terms of education, comparing maths to sports science:
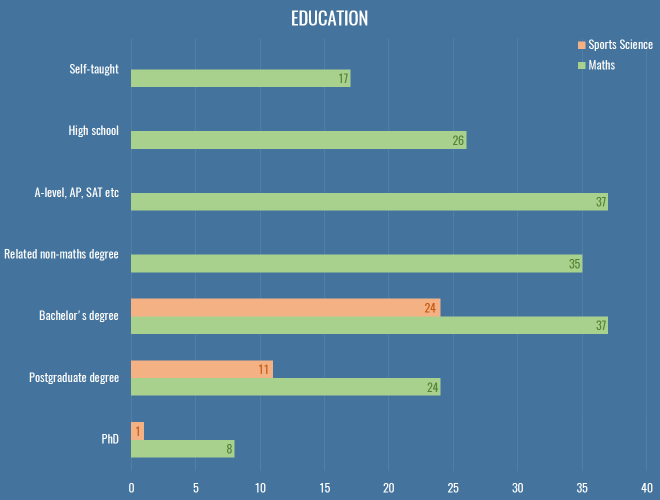
Of the roughly 40 respondents that work in clubs or as professional consultants, only two got there without at least a bachelor’s degree either in a mathsy or sports science subject.
We had about 40 respondents with a formal coaching qualification, including 3 UEFA A Licencees. What made me especially happy was to see these people reporting skills with R and Python, and beyond, making it clear that there’s an increasing expectation of data skills even in the traditional roles in the sport.
What do we do?
In case you’re looking for a niche to fill, here are the stats for different types of work people were engaged in in 2016:
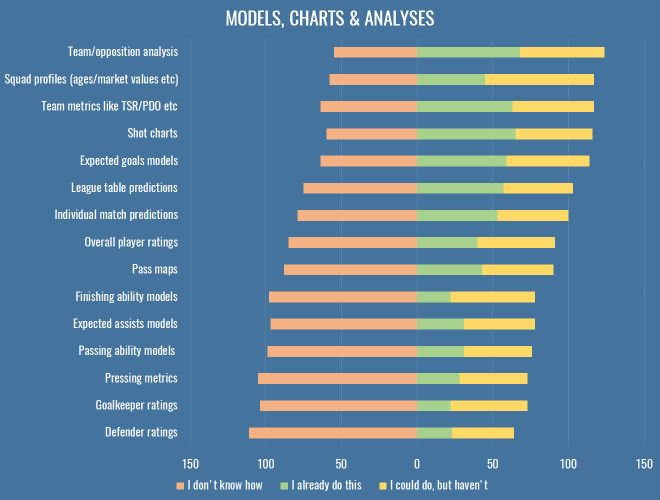
Once more, we find all the grubby stuff that has nothing to do with attacking at the bottom, which isn’t much of a surprise. If you’re working on attacking metrics in 2017, perhaps you might want to take a step back and see if your efforts could be better spent elsewhere. And if none of the above interest you, let’s have a trawl through the varied responses to the ‘Other’ option from this question:
- Evaluating crosses
- Evaluating counter-attacks
- Various time-in-possession measures
- Stability of possession
- Multitudes of non-shot models
- Measuring decision making
- Some version of WAR for football
- Cloning IMPECT/Packing
Here’s what people suggested you should work on in 2017:
- Simplifying and making actionable all your output
- Set piece analysis
- Treating events as sequences/networks
- Better GK metrics
- Studying transitions, identifying styles, the good, the bad
- A standardised definition of ‘possession’ for everybody to share and work from
- Measuring decision making
- Youth development
- Quantifying stats in monetary terms (e.g. for contract negotiations)
- Dribbling metrics
- Defence, goalkeepers, dear God anything but shots and xG
- Whatever increases a causal understanding of the sport
So, you can take all that to the bank.
Tools & Platforms
Here’s how we do what we do:
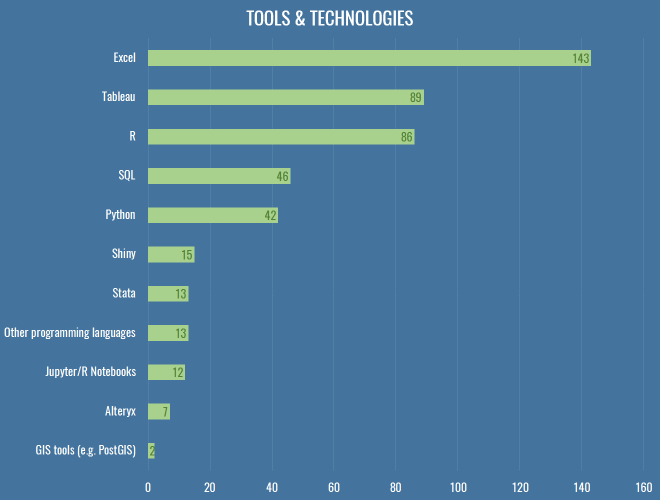
The geek in me wanted to get a bit more detailed this year, and find out who’s using GLMs versus random forests and stuff, but let’s be honest: a lot of analytics really is just swapping CSVs and scrolling around in Excel, which really explains why Tableau comes second here, being a slightly less painful version of that. People regularly ask me how to choose between R and Python, which annoys me because I had hoped Clojure would one day win, but its numerical computing suite (Incanter) has long since died. You should learn Python, all things being equal. R is great, and very productive in the first instance, with an enormous suite of maddeningly inconsistent libraries for almost anything you could stumble across on Wikipedia. You will have a long and happy career going from data, to slightly cleaner data, to ggplot2. But R is an atrocious general purpose language and runtime, has terrible error messages and documentation, and doesn’t have the depth of community that Python has in the wild. On top of that, distributed, GPU-based computing is going thriving more on Python than R, and as much football analytics is probably already going through the throes of well-reasoned-statistical-models versus wtf-black-box-deep-learning, the skills involved in the latter are going to prove hugely more valuable in industry over the next 10-20 years, and the bindings will appear on Python first, almost every time.
All that said, develop a brain and an eye for football first. There are people out there doing better work in Excel than you with your $20,000 of Amazon Web Services credit because they fundamentally know where to look better than you do.
In addition to these fundamental tools, almost a third of respondents used a video platform like WyScout or InStat. Not only are these essential parts of your recruitment and analysis pipelines within a club, they’re also hugely useful to confirm that things you’re seeing the data are actually real, or to find weird obscure bugs where possession chains last for ten minutes because someone had a head injury followed by a drop-ball.
What do we want?
Experience & Interests
We’re a disparate bunch, and it fills me with glee that something as simple as a bunch of spreadsheets can lead to so many different dreams and careers. Most of us are into stats because we feel it helps us understand the game better, but beyond that, we’re putting content out with the hope of one day getting paid, inside or outside the game.
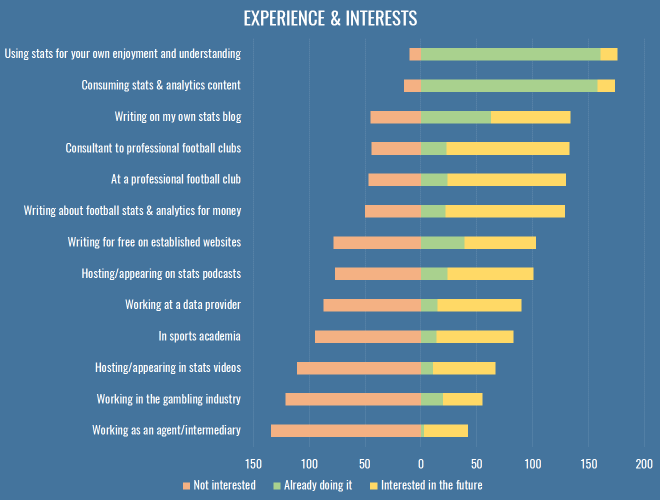
I added a couple of options this time just based on the different people I’ve met and chatted to over the last year, but it turns out not many people are interested in gambling or the intermediary business. I’ll let you all chase those £20k analytics jobs and £25-an-article writing gigs for a couple of years and then you can maybe re-examine the parts of the sports industry where the real money is, and where the edges really make a difference. ¯\_(ツ)_/¯
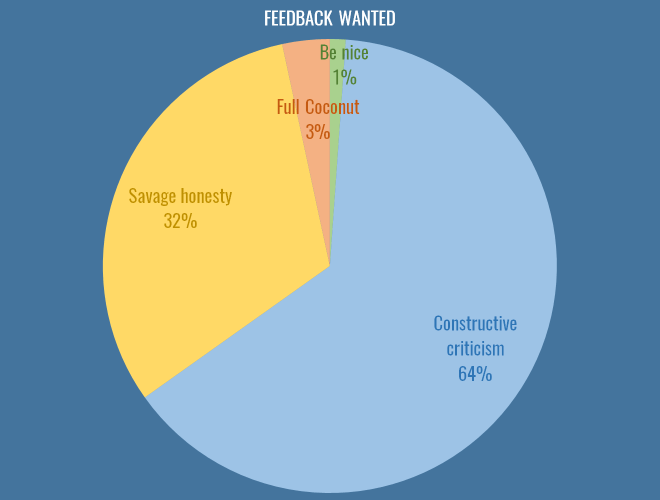
Feedback
An issue that bubbles up again and again on Twitter is how best to give feedback. It is an incredibly difficult and delicate issue, but here is how you responded:
I put this in for a variety of reasons, some of them personal. I must admit, when I first got into analytics (a little over a year ago, publicly), I produce some absolute dross. Misleading, badly thought out, dead-end crap. I got likes and retweets… precious #numbers on Twitter for those polygonal attacking charts, and numbers are the mind killer. You get addicted to the numbers. You feel validated by the numbers. Those charts were borne out of studying attacking buildup (possession chains, as the good doctor would have us call them). I truly believe the use of space and speed are absolutely central to attacking play, and they were one exploration of that, both on a football level of just seeing what different teams looked like, but on a technical level, of working out possession chains, and calculating convex hulls of possessions given their coordinates. These are incredibly valuable things for me, and I was incredibly grateful for both the kind words and the feedback I received. But let me be absolutely clear about those charts: they will never ever win anyone a football game. This dawned on me, and was also pointed out to me by people in the game, and I moved on (to other stuff that is also probably of dubious worth, but hey, it’s a process).
This is how the system should work, more or less efficiently. People need space to experiment with data, develop ideas, learn about the game, and test the waters of people’s interest inside and outside the professional game. And I’ll also point out here that stats as entertainment is also completely valid. Not everything needs to be aimed at professional clubs, or even winning statistical arguments. But I think as a community, we need to learn to draw that line extremely clearly. Because there is abysmal and colourful work out there that reveals nothing but the fact that its creator had some data and wanted to do something with it. There’s work that gets widely retweeted, that leads to more of the same, on a schedule, for every club and every game, and the numbers increase, but the ideas underlying the work stagnate. Nothing new is added, no assumptions are invalidated, nothing is tested against real games. One example this week of avoiding this cycle was Sander exploring some centrality measures from graph theory in his passing charts (already the most controversial visualisation in football analytics). I know some people haven’t worked out the mute buttons on their Twitter clients and post game viz can clog their timeline, but I’m at least impressed that he’s not just taking the retweets and sitting here. I hope we’ll all experiment with new metrics while still trying to relate them back to fundamental theories about the game of football.
At the same time, we have terrible communal memory about what’s been tried and found unhelpful before. Part of this is that we, grumpy and defensive about our work as we are, have managed to drive elder statesmen of the field like Dan Altman away (and he seems to be doing okay without Twitter). Dan’s intentions could be hard to fathom, he would judge other people’s work despite the details of his own being proprietary secrets, which often felt inequitable. But we should also be honest – all the people that responded above that they wanted to work professionally in clubs with analytics, every single one is competing with each other. For recognition, for prominence, so they can one day get one of those sweet £20k a year jobs. Despite all of that, most feedback, however vicious it might seem via the tone-deaf medium of Twitter, is coming from a place of statistical truth or practical football experience. Some of it is foul-mouthed, but I believe these people would still buy you a pint at the Opta Pro Forum.
If the above chart tells you anything, it’s that people want feedback on their work. They may not want the savage but artful trollistry of an anonymous coconut, but they want to learn, and get better. Sure, they want numbers too, and they need space to experiment, but I don’t believe were killing promising ideas in their cribs by pointing out flaws in nascent work.
Impediments
So, what’s stopping us doing better work? This is what people thought:
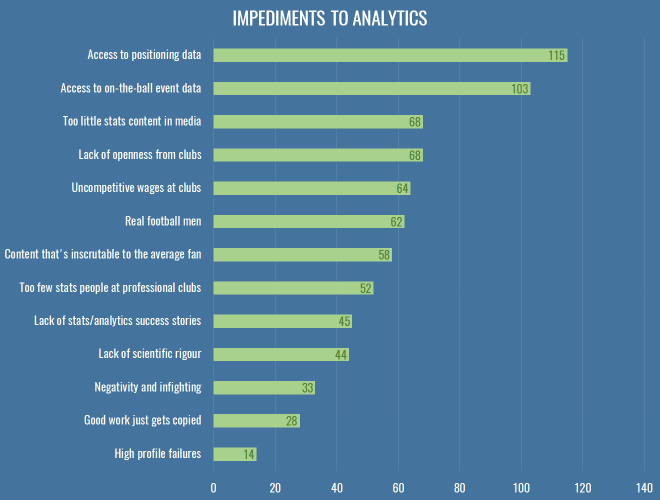
Everybody wants data. More data, better data. I was a bit sad to see ‘lack of scientific rigour’ down there, because it just means when we get all this data we’ll make a massive mess of it, thus Dr Marek Kwiatkowski’s seminal piece. But I stand by my comments that we need to play and explore before we make much progress.
THE BIT WHERE I GET YOU SOME FREE DATA
And so I bring good tidings: the nice people at Stratagem have a standing offer to anyone with a blog that wants to write about sports data:
As a company we are simply looking to increase the awareness of our unique dataset through partnerships with prolific and respected members of the analytics community. We have a team of over 50 performance analysts who have collected data on over 10,000 matches from 22 professional football competitions to date, with specific focus put upon on chance quality. We break scoring chances down into six categories and collect granular details such as number of players between the ball and goal, defensive pressure and shot quality. All matches since June 2016 come complete with XY coordinates on key events such as goals, chances and assists.
If you’d like some data to write an article and you’re happy attributing the source, you can contact Dave Willoughby directly, or head over to the Stratagem website to find out more about what they do.
On top of that, you can also join the efforts over at WoSo Stats, a community that gathers and analyses data about women’s soccer. I suspect they are always on the lookout for anyone who can help keep their hand-coded data up-to-date.
So, that is a step in the right direction, and nobody even mentioned the dark lord’s name. Aside from data, you’ll note that the option about club wages scored highly, whereas very few people chose the two ‘aggro’ options near the bottom – indicating once more that people really are looking for healthy debate and robust feedback of their work. I put in the question about copying work because it’s something I often hear grumbles about, but generally I think it’s entirely healthy for people to clone and (preferably) elaborate on others’ work, as long as some minimum amount of credit is given. If anything, I think we should be making it vastly easier to copy and replicate our work, which can only have a positive effect on the robustness of our conclusions.
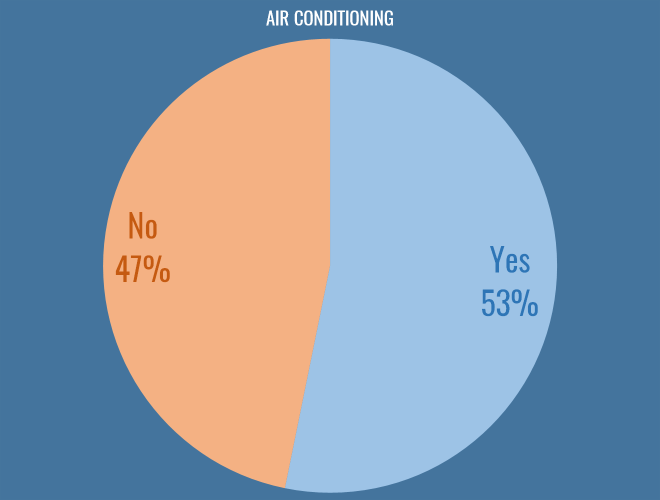
Air Conditioning
Possibly the most fundamental philosophical question facing us as football analysts today is whether or not you work in an air conditioned office. I am glad to say that the scales are tipping in favour of climate control, and I hope clubs continue to invest in this essential technology:
Conclusions
It’s been a funny year. With SmartOdds canning their analytics department it felt like the one organisation that really shouted about their use of stats had stepped back, damaging the field. As I hope some of these results show, the work still goes on elsewhere, just slightly more quietly.
For a while it seemed like there was a dearth of new work in the fanalytics community, with a lot of people having moved on from Twitter for professional or personal reasons. But towards the end of the year, there’s been a fantastic influx of new stuff. I don’t really want this to turn into a roundup of the best work in 2016, and I also don’t want to risk missing anybody out, but I feel going into the new year that there’s a strong cohort of active, prolific people shining a light in exactly the right areas.
Anyway, I promised myself I’d get this out in 2016, so if you’re looking for a rousing conclusion you’re out of luck. All I’ll say is that if you do even semi-good work in public, good things will happen to you, no matter how many crappy Sherwood memes you tweet to try and make yourself unemployable.
State of the Stats 2016
Time to Tiki-Taka
Speaking to Bild this week, Giovanni Trapattoni is quoted criticising Pep’s style at Bayern Munich:
For me there’s too much possession. Tick, tack, tick, tack. Tuck, tuck, tuck. To and fro. With too little return. And after 27 minutes they shoot on the goal for the first time – that’s inefficient.
Tobi (@redrobbery on Twitter) posted some passes-per-shot numbers dispelling this myth, showing that FCB are actually pretty decent at getting regular shots on target:
Trapattoni says Bayern pass too much without taking shots. Here’s this season’s Champions League data. pic.twitter.com/g0Aac6Eo2s
— tobi (#14) (@redrobbery) 7 April 2016
I thought I’d add to this with some time-to-shot-for numbers because they are even more pronounced. Here’s the median TTSF for each team’s passing in the Champions League, that is, the average number of seconds it takes between a pass and a shot:
| Team | TTSF |
|---|---|
| Real Madrid | 119 |
| Bayer 04 Leverkusen | 146 |
| FC Bayern München | 148 |
| Atlético de Madrid | 150 |
| Juventus | 167 |
| Lyon | 173 |
| Galatasaray | 174 |
| Roma | 175 |
| Manchester City | 181 |
| Barcelona | 188 |
| Paris Saint-Germain | 192 |
| Olympiakos | 193 |
| Manchester United | 199 |
| VfL Wolfsburg | 199 |
| Benfica | 201 |
| FC Astana | 210 |
| Chelsea | 220 |
| Arsenal | 222 |
| FC Porto | 223 |
| Sevilla | 224 |
| Valencia CF | 227 |
| Borussia Mönchengladbach | 237 |
| Dinamo Zagreb | 238 |
| Shakhtar Donetsk | 238 |
| Dynamo Kyiv | 253 |
| KAA Gent | 261 |
| Zenit St Petersburg | 267 |
| CSKA Moscow | 277 |
| Maccabi Tel Aviv | 284 |
| PSV | 315 |
| Malmö FF | 399 |
| BATE Borisov | 510 |
Borisov messing with my colour scheme there, but still – there you go: 2 minutes, 28 seconds, a mere factor of 10 out for Trapattoni. It’s a pretty reliable number for Bayern too, if you look here at the distributions of each team’s TTSF values for passes:
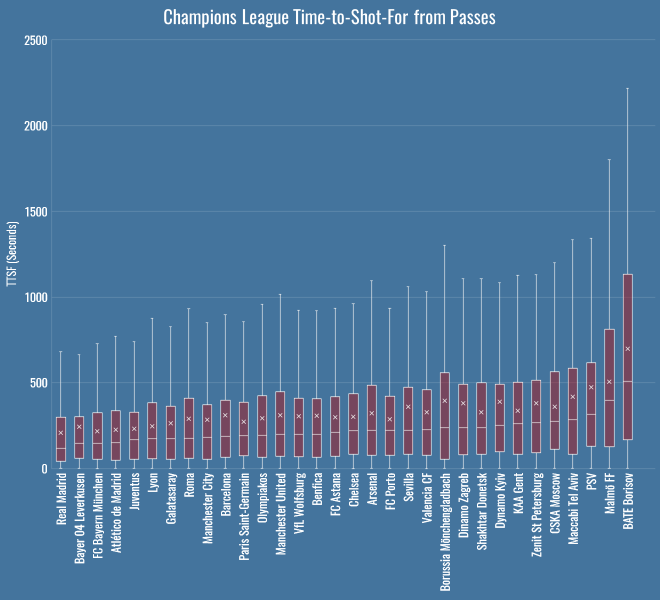
Even at their absolute slowest, Pep’s team have only been about 750 seconds from tick, to tack, to shot.
Time-To-Shot
Expected goals, in all its forms, lets us measure the danger of a shot. There are increasingly many non-shots expected goals models that go beyond this, measuring the danger of the attacks that build up to shots, or beyond, to cover all the different situations that can occur in a game. In fact here’s Sarah Rudd, now of StatDNA, talking about a model using Markov Chains all the way back in 2011. In the ideal world what we want is to be able to show a computer a game state – as if we’d been watching the game on TV and hit the pause button – and ask, how good or bad is this situation for each team?
Today I’m going to introduce an extremely simple (really, overly simple) approach to answering that question, called Time to Shot, or TTS. TTS looks at a particular game state and simply calculates the time – in seconds – until the team in possession makes a shot (Time To Shot For, or TTSF) and the time until their opponents make a shot (Time To Shot Against, or TTSA). The lower this time, the more dangerous the situation for one team or the other, the higher the time, the safer. Obviously this isn’t taking into account the quality of the shot, and that’s a pity, but it has the advantage that it’s enormously simple to implement.
In this post, we’ll use raw, real-world values for TTS, looking at team averages for a bunch of interesting situations. Then, over the next few days and weeks we’ll also see if we can build a predictive model that’s any better than just taking the average, so that we can ask more complicated questions. For example, which players reduce expected TTSF or increase expected TTSA the most? Which teams *cough* Leicester *cough* seem to be able to pull shots out of nowhere in contrast to their expected TTSF?
My hope is that ‘time to shot’ outputs are much easier to communicate, especially in neutral situations, than tiny probabilities. An xG from some possession far from the goal of about 1 in 1000 for and 1 in 3000 against is pretty hard to visualise. But if I tell you a specific game state is on average 120 seconds away from a shot for and 360 seconds away from a shot against, it’s a bit more grounded in reality.
It’s also easy to wrap your head around for particular short-term strategies:
- Most of the time you’re looking to decrease your TTSF (to zero, hopefully) without drastically decreasing your TTSA.
- If you are a counter-attacking team, you might allow a team to decrease their TTSF, as long as your TTSF is also coming down.
- If you’re trailing towards the end of the game, you might risk reducing your TTSA for a decrease in your TTSF.
- If you’re ahead in the dying minutes of a game, you’re probably more concerned with increasing you TTSA at the expense of everything else.
Okay, I said it was easier to communicate and then used a bunch of abbreviations to make it sound complicated, but seriously, I just think it’s easier to visualise as a concept. And just so you know – if you have the ball, then on average you’re 4 minutes 3 seconds away from having a shot, and 4 minutes 57 seconds away from conceding one. This dearth of action presumably explains much of the defending we see in the MLS.
League Table
Here’s the TTS league table – TTS (F)or, (A)gainst and (D)ifference, the latter calculated as TTSA minus TTSF:
| Team | TTSF | TTSA | TTSD |
|---|---|---|---|
| Manchester City | 185 | 395 | 210 |
| Tottenham Hotspur | 187 | 386 | 199 |
| Liverpool | 187 | 365 | 178 |
| Arsenal | 204 | 312 | 108 |
| Manchester United | 253 | 354 | 101 |
| Chelsea | 217 | 301 | 84 |
| Bournemouth | 255 | 334 | 79 |
| Southampton | 232 | 305 | 73 |
| Leicester City | 238 | 280 | 42 |
| Everton | 244 | 280 | 36 |
| Stoke City | 267 | 288 | 21 |
| Aston Villa | 282 | 287 | 5 |
| West Ham United | 245 | 249 | 4 |
| Norwich City | 284 | 280 | -4 |
| Swansea City | 281 | 275 | -6 |
| Watford | 278 | 266 | -12 |
| Newcastle United | 269 | 256 | -13 |
| Crystal Palace | 291 | 248 | -43 |
| Sunderland | 289 | 236 | -53 |
| West Bromwich Albion | 305 | 251 | -54 |
On average, you’re 185 seconds away from a Man City shot, whereas millions of mayflies hatch into their adult form, only to die never having seen West Brom shoot. City are making history with their shots conceded numbers, and they win the TTSA battle here as you’d expect. Now, remember that TTSF and TTSA are values for the team in possession, so the average TTSA will be higher, as the opponent would need to first win the ball back before they can eventually make a shot.
Overall these numbers aren’t very interesting, nor are they news – we already have shot totals and per 90s, so what’s the point?
Pressing & Counterpressing
The point is, we can do things like this, splitting team’s values up by different event types:
| Team | Ball Recovery | Dispossessed | Interception | Tackle |
|---|---|---|---|---|
| Tottenham Hotspur | 184 | 211 | 211 | 212 |
| Manchester City | 186 | 196 | 206 | 222 |
| Liverpool | 196 | 253 | 199 | 222 |
| Chelsea | 206 | 215 | 250 | 247 |
| Arsenal | 212 | 221 | 242 | 237 |
| Leicester City | 246 | 227 | 283 | 280 |
| Everton | 247 | 224 | 302 | 310 |
| Southampton | 252 | 258 | 276 | 276 |
| West Ham United | 256 | 230 | 306 | 331 |
| Manchester United | 257 | 285 | 291 | 287 |
| Bournemouth | 259 | 309 | 272 | 308 |
| Newcastle United | 273 | 264 | 276 | 325 |
| Stoke City | 273 | 292 | 275 | 319 |
| Norwich City | 285 | 265 | 356 | 355 |
| Watford | 286 | 325 | 310 | 311 |
| Aston Villa | 289 | 316 | 336 | 345 |
| Sunderland | 290 | 323 | 315 | 333 |
| West Bromwich Albion | 294 | 329 | 367 | 345 |
| Swansea City | 301 | 329 | 298 | 291 |
| Crystal Palace | 306 | 322 | 348 | 300 |
These are the median TTSF values for a variety of actions related to pressing – note that Pochettino’s Tottenham are the quickest team on average to take a shot after a ball recovery. Liverpool aren’t far behind – under Rodgers this numbers was 217 seconds, with Klopp it’s been 191 on average, and indeed they lead the league on TTSF from interceptions. Look at Liverpool’s TTSF off dispossessions though – it seems low, implying that they’re not generating many shots from counterpressing opportunities.
These absolute numbers don’t necessarily tell us anything about team style – better teams get shots off more quickly no matter the situation. Let’s make sure we’re actually measuring a real pattern here, and look at the TTSF values as a percentage of the team’s average.
| Team | Ball Recovery | Dispossessed | Interception | Tackle |
|---|---|---|---|---|
| West Bromwich Albion | 83% | 93% | 103% | 97% |
| Manchester City | 83% | 87% | 92% | 99% |
| Tottenham Hotspur | 83% | 95% | 95% | 96% |
| West Ham United | 84% | 76% | 101% | 109% |
| Bournemouth | 85% | 101% | 89% | 101% |
| Chelsea | 85% | 89% | 103% | 102% |
| Norwich City | 86% | 80% | 107% | 107% |
| Liverpool | 86% | 112% | 88% | 98% |
| Manchester United | 87% | 96% | 98% | 97% |
| Everton | 88% | 80% | 108% | 110% |
| Watford | 88% | 100% | 96% | 96% |
| Aston Villa | 88% | 97% | 103% | 106% |
| Leicester City | 88% | 82% | 102% | 101% |
| Arsenal | 89% | 92% | 101% | 99% |
| Newcastle United | 90% | 87% | 91% | 107% |
| Sunderland | 90% | 100% | 98% | 104% |
| Stoke City | 95% | 102% | 96% | 111% |
| Southampton | 96% | 98% | 105% | 105% |
| Crystal Palace | 100% | 105% | 113% | 98% |
| Swansea City | 100% | 109% | 99% | 97% |
That dispossession number really sticks out now – as a percentage of their average, Liverpool’s TTSF off dispossessions is the worst in the league. Their pressing is certainly affording them some control, as detailed by Dustin Ward in his recent excellent piece on Liverpool, but they’re either unable or unwilling to create scoring opportunities from counterpressing.
Forget the minutiae of pressing for a moment, what I’m trying to show you is this: we have a metric we can employ for every team, anywhere on the pitch, for any type of event.
Defensive Areas
Part of the motivation for a metric like this is experimenting with replacements for ball progression in PATCH. Different teams allow ball progression in different areas, because they’re set up to deal with it. A famous example this year is Leicester, who often allow opponents to penetrate down the wings, because their low block is often able to mop up afterwards. These tables represent a football pitch split into a 10×10 grid, with the defending goal in the middle on the left. The percentages are the ratio of the opponent’s TTSF in that grid square, compared to the global average. So, high, green values are safer spaces – areas where the opponent is usually further away from a shot. Low, red values are areas in which opponents are closer to a shot on average. Here’s Leicester:
| Area | 0-10 | 10-20 | 20-30 | 30-40 | 40-50 | 50-60 | 60-70 | 70-80 | 80-90 | 90-100 |
|---|---|---|---|---|---|---|---|---|---|---|
| 0-10 | 95% | 143% | 108% | 142% | 97% | 137% | 87% | 135% | 82% | 74% |
| 10-20 | 178% | 59% | 71% | 86% | 77% | 96% | 121% | 62% | 13% | 75% |
| 20-30 | 56% | 18% | 93% | 79% | 110% | 88% | 99% | 115% | 172% | 93% |
| 30-40 | 66% | 24% | 60% | 123% | 144% | 92% | 121% | 89% | 111% | 105% |
| 40-50 | 1% | 34% | 86% | 146% | 53% | 115% | 75% | 196% | 164% | 80% |
| 50-60 | 196% | 120% | 44% | 93% | 104% | 42% | 90% | 124% | 108% | 113% |
| 60-70 | 67% | 63% | 76% | 50% | 85% | 101% | 154% | 129% | 50% | |
| 70-80 | 149% | 6% | 108% | 115% | 170% | 104% | 104% | 132% | 164% | 144% |
| 80-90 | 86% | 20% | 98% | 89% | 118% | 49% | 233% | 130% | 99% | 86% |
| 90-100 | 93% | 102% | 116% | 107% | 75% | 115% | 93% | 109% | 81% | 51% |
You can see that in their own half, down the flanks, Leicester keep their opponents to an above average TTSF. Compare and contrast to Everton:
| Area | 0-10 | 10-20 | 20-30 | 30-40 | 40-50 | 50-60 | 60-70 | 70-80 | 80-90 | 90-100 |
|---|---|---|---|---|---|---|---|---|---|---|
| 0-10 | 74% | 63% | 68% | 76% | 93% | 105% | 55% | 135% | 113% | 82% |
| 10-20 | 23% | 89% | 98% | 74% | 76% | 137% | 132% | 76% | 110% | 42% |
| 20-30 | 16% | 29% | 112% | 115% | 95% | 55% | 61% | 94% | 189% | |
| 30-40 | 1% | 137% | 67% | 71% | 120% | 77% | 58% | 42% | 106% | 102% |
| 40-50 | 86% | 10% | 105% | 52% | 99% | 62% | 80% | 93% | 101% | 125% |
| 50-60 | 122% | 35% | 116% | 52% | 125% | 85% | 87% | 129% | 62% | 124% |
| 60-70 | 149% | 73% | 36% | 53% | 119% | 98% | 88% | 81% | 95% | 102% |
| 70-80 | 15% | 12% | 74% | 97% | 83% | 127% | 125% | 122% | 92% | 37% |
| 80-90 | 35% | 35% | 61% | 28% | 61% | 120% | 93% | 103% | 51% | 333% |
| 90-100 | 31% | 37% | 59% | 97% | 111% | 175% | 91% | 120% | 89% | 94% |
Everton seem pretty weak down the flanks in comparison. You can imagine plugging this into PATCH – look at each opponent’s attacking moves, observe the average opponent’s TTSF values, and instead of judging a defender by the ball progression, judge them by how much closer we think the opponent is to a shot having been allowed to move through that defender’s territory.
Again, there’s no magic here, I’m just hoping to convince you that this is a flexible little metric that we can apply to all sorts of situations.
Time Wasting
Another simple application is time wasting. Which teams are best at keeping their TTSA up when they’re leading? This table shows TTSA at +1 goal difference as a ratio of the team’s TTSA when tied, all limited to 80 mins plus, when we’re reasonably sure a team ought to be protecting their lead:
| Team | Ratio | Games |
|---|---|---|
| Liverpool | 291% | 12 |
| Sunderland | 196% | 7 |
| Norwich City | 188% | 6 |
| Watford | 139% | 8 |
| Aston Villa | 127% | 3 |
| Crystal Palace | 104% | 9 |
| Newcastle United | 101% | 6 |
| West Bromwich Albion | 97% | 11 |
| West Ham United | 97% | 10 |
| Bournemouth | 96% | 8 |
| Stoke City | 87% | 9 |
| Chelsea | 86% | 8 |
| Manchester City | 85% | 6 |
| Southampton | 77% | 7 |
| Swansea City | 66% | 9 |
| Manchester United | 65% | 13 |
| Arsenal | 62% | 9 |
| Tottenham Hotspur | 57% | 10 |
| Everton | 56% | 6 |
| Leicester City | 45% | 13 |
We can probably ignore Villa as it’s such a small sample size, but Liverpool are the kings of sitting on a 1 goal lead with safe possession. This is slightly odd as their collapse against Southampton is fairly fresh in the mind, but it’s true – one goal up after 80+ minutes their shot suppression numbers are good in absolute terms, but even better compared to tied game states. Also riding high are Sunderland, helmed by Sam Allardyce, who rates well in an analysis by Daniel Altman about teams camping out in the corner when ahead at the end of the game.
At the other end, Leicester, who have recently extended their run to five 1-0 victories in six matches… what’s up with that? Well, obviously they’re up 1-0 a lot, but that doesn’t explain why this relative value is so bad – but it’s real. They really are losing the ball and conceding shots more than twice as quickly when defending a lead than when tied. I suppose this is their “bend, don’t break” defence in action, i.e. do all the things a bad defence would do, short of losing. ¯\_(ツ)_/¯
Substitute Effects
Let’s have a look at how substitutes affect teams’ TTS numbers. There are certainly some interesting outliers:
| Team | TTSF | TTSA |
|---|---|---|
| Tottenham Hotspur | 100% | 81% |
| Southampton | 87% | 91% |
| West Ham United | 80% | 96% |
| Everton | 112% | 101% |
| Chelsea | 115% | 102% |
| Newcastle United | 114% | 111% |
| Manchester City | 114% | 114% |
| Watford | 113% | 118% |
| West Bromwich Albion | 61% | 125% |
| Sunderland | 105% | 127% |
| Swansea City | 87% | 127% |
| Stoke City | 97% | 128% |
| Leicester City | 109% | 128% |
| Norwich City | 127% | 130% |
| Liverpool | 81% | 131% |
| Aston Villa | 88% | 133% |
| Bournemouth | 98% | 136% |
| Crystal Palace | 115% | 138% |
| Arsenal | 97% | 139% |
| Manchester United | 97% | 149% |
When Pulis sends a man on, a shot will surely follow. Now that’s probably not a huge surprise, if perhaps he only makes substitutions before corners – for my sins I didn’t check, because look at that other number sticking out like a sore thumb: when Tottenham make a substitution, their TTSA falls to 81% of its usual value! I asked a few people about this possible pattern on Twitter, and a few pointed the finger at the looming presence of Ryan Mason. More generally, it seems possible that either Pochettino’s system requires a degree of concentration that can be disrupted by substitutions, or perhaps Tottenham’s squad depth is lacking and the subs are just plain bad. Or maybe he just sends people on before defending corners. Either way, an interesting one to follow up later.
John Stones
One final one, just because I thought it was too cute not to share. John Stones, as we know, likes to bring the ball forward at his feet. We’ve seen his Cruyff turns, but what do they contribute? Well, the time-to-shot-for from a John Stones take on is 258 seconds. The time-to-shot-against? 258 seconds. That’s right, every time you see him dribble, you will know that we stand delicately positioned at the nexus of possibilities, a cosmic coin-flip deciding whether Stones is to be the hero or the villain.
Conclusions
So, there you have it, Time-to-Shot, a dead simple metric for measuring all sorts of stuff. Given that some of the results above are a little surprising, we ought to poke deeper and make sure we’re not missing anything important. There are certainly some caveats:
- Events occurring when there is no shot for the rest of the half don’t get a TTS value, so this generally skews the values lower than they should be. One way around this is giving missing values a static, high value for TTSF and TTSA, but that’s a bit arbitrary.
- Sample sizes for calculating averages drop the more criteria you add, increasing the uncertainty.
- We don’t include any measure of shot quality. This is another model that reflects Liverpool’s good work at reducing the number of shots they concede, but ignores the quality of chances they conceded, which has at various points undone all that work.
Next stop is the almost impossible task of creating a predictive model to estimate TTS values for events. It’s unlikely we’ll get close to the average (still pretty bad) accuracy of an xG model, but being able to compare player’s actual TTS values to even a vaguely sensible estimate will hopefully give us some interesting results in the aggregate.
I hope you don’t think this metric is just complete junk, though I’ll admit I’ve been back and forth about it for a long while. It is certainly not as powerful as a decent non-shots xG model, but the fact that it can be applied to so many different situations with such ease is hugely attractive to me. If a predictive model is at all possible I think it’ll yield some useful results. Either way, happy to take the abuse here or on Twitter if you think it’s not worth pursuing. Alternatively, if there are any interesting teams or situations you’d like to see measured with this approach, get in touch.
I’m also looking for feedback on these new slightly garish colour-scale tables. I’ve gone with a design that I think is clearest at a glance, but it might be too much for people. Other designs are available.
My Stats #8245–8249 & 117
I spend a lot of time working on new models and metrics, watching games and generally mucking about with football stuff, but very little of it sees the light of day. Sometimes I fall out of love with an idea, sometimes it just doesn’t pan out, sometimes I hit the limit of what my brain (or for that matter my free time) can handle and give up.
Today, I’m going to take you on a tour of my drafts folder in WordPress, and as a weird form of primal scream therapy, I’ll give you a sample of some of the ideas I’ve had over the last few months and stalled on. I’ve no idea if this will be in any way useful or inspiring for people, but I hope at the very least that you’ll read it and think, “hey, that guy’s ideas are stupid, I could do this!”
As a festive but belated Easter bonus, I’ve also added a ‘probability of resurrection’ to each idea, so you can see which ones are victims of mere procrastination instead of actual shame.
The Path of Least Resistance
This idea is sort of the intersection of all the shot chart and PATCH stuff I’ve done – can you calculate and plot the areas where a team (or indeed a particular lineup) are weakest? Is it possible to visualise the path of least resistance, along which you’ll find it easiest to progress towards your opponent’s goal?
This isn’t supposed to sound grandiose, or like some universal metric that just tells you how to beat teams, but I genuinely think it would be great to have a visualisation that combined the shot and PATCH charts, to be able to get a feel – at a glance – for where your own team is weak, or where prospective opponents might be weak.
There are a few ways to do this, the first quick attempt I tried was purely visual, plotting big fat lines on a pitch wherever you conceded ball progression, overlaying them, and changing the colour of the overlaps as they get more and more used. This looked almost comically vomitous, so I paused to work on both a better model and visualisation.
Review: promising, until we got to the word ‘vomitous’.
Probability of resurrection: 6/10
Dangerous Dispossessions & Forward Retention
I spent a long time cobbling together stats for an extremely snarky piece about Everton’s ‘Fab Four’ of Barkley, Stones, Deulofeu and Lukaku. The general idea being, each player had bad habits, and we could judge Martinez by the degree to which those habits were being trained out. To be quite honest, three of those players have been fine and/or excellent this season so I cooled on the idea, plus I could never find the exact right metric to test against.
A couple of things I came up with were quite fun though. The first was ‘dangerous dispossessions’. Ross Barkley has spent large swathes of his career dribbling into trouble and losing the ball, and I started watching games with a eye for one thing: how many shots from counter-attacks did Everton conceded when Barkley was dispossessed? The idea being, some players really shouldn’t be dribbling, because they give up more equity than they ever gain. For a second I thought I had him with this, he and Alexis Sanchez featured highly, but after I’d per ninetified everything and used xG instead of raw shots, Barkley stopped sticking out so much.
The second metric I looked at was ‘forward retention’, where you don’t just look at pass completion, you also look at the success of the player you’re passing to, the idea being that some players might play their team-mates into trouble. And then you’ll want to look at whether players are playing passes that are too safe and build a model to allow you to look at the risk vs reward of individual passes etc etc.
Review: better if all this was subsumed into a more general model that looked at events on the pitch and their actual vs likely outcomes.
Probability of resurrection: 3/10
Peak xG
I was thinking about this partly as a way of measuring striker positioning, but also in light of Damien Comolli’s mention of judging defenders by interceptions on the Analytics FC podcast (about 30:52 in). Basically, you can sample along the line of an attempted cross or throughball or whatever, and calculate what could have been the maximum xG for a resulting shot. You can then hope to judge a striker’s positioning by whether they met the ball at its point of peak xG (or if they indeed exceeded it by taking a touch or whatever). You can also hope to judge defenders by measuring how dangerous a shot they prevented through an interception.
Review: probably very simplistic in a world with positioning data, but might be interesting to see a few numbers.
Probability of resurrection: 5/10
Pinball Charts
This was an alternative I imagined to the (rather busy looking, these days) PATCH charts, and part of my frustrated obsession with making charts as animated gifs. The idea was to plot the lines of an opponent’s attacking possession as it moved over the pitch, ‘activating’ defending players’ territories as the lines entered. Territory polygons would start faded out almost completely but become more visible when entered, a bit like a bumper lighting up when hit on a pinball table. If the possession ended in a territory, we’d make it more green (yay, you stopped an attack), if it passed through and out the other side, we’d make it more red (boo, you failed).
I didn’t get very far with this, if only because the graphics library I’ve been using for everything is a little hateful. But I think it would solve a lot of problems with charts that get very busy, and I’m eager to at least see people experiment with whether any useful information can be communicated with animation of this sort of data.
Review: this would probably annoy enough people on Twitter to be worthwhile.
Probability of resurrection: 9/10
Expected Yellows
Clubs are looking for any edge they can get in games, and I would love to build some referee models. The easiest to do with the data that’s out there is expected yellows: given a foul, what is the likelihood of a player being booked for it? Can we find more/less lenient refs, unfairly maligned players versus those immune to punishment, areas of the pitch where it’s safer to put in a professional foul? Could all be interesting, but there’s only about 1000-2000 cards a season depending on the league, and those for a variety of offences, so it’s quite difficult to pin down any patterns with confidence, and that’s before taking into account that the data doesn’t contain how dangerous a particular tackle was.
Expected offsides would be another wonderful model to have if you were intent on destroying the beautiful game at all costs.
Review: not enough data to do a decent job at this stage.
Probability of resurrection: 4/10
Passing Variety
This is one of those weird ones where I’m sure someone already did this, but I may just be misremembering Marek Kwiatowski’s article on Statsbomb about classifying central midfielders. Anyway, what I wanted to do was look at similar metrics to Marek, the pass direction and length, but see which teams had built midfields with a variety of passing styles, as opposed to just the same profiles across the board. Then of course you’d have to look at which approach actually worked better, or whether different lineups enabled teams to handle different opposition better etc. If this sounds familiar to anyone and they know the article I’m talking about, please get in touch so I know I’m not dreaming it.
Review: would be interested to read even if it already exists.
Probability of resurrection: 9/10
Corner Positions
I don’t remember ever making this, but it’s the only one of these that has code which worked first time, so I can actually give you some pictures. what you’re seeing here is players’ aerial performance from corners (straight from corners, whoever wrote this code never bothered to include headers after the first). Size is volume, colour is the ratio won and the centre of each players’ circle is their average position for aerial challenges. Left side of pitch is for corners from the left, right is for right, so picture them coming from the bottom of the screen.


Both Merseyside teams covering themselves with glory here.
Review: a bit sparse, probably interesting to someone though.
Probability of resurrection: 6/10
CROTCH
This wasn’t actual work per se, but after dropping the Possession Adjusted bit from PATCH, and talking about it on the Analytics FC podcast, it occurred to me that CROTCH would be a magnificent acronym. Control Retained Over Territory something… something. Didn’t pan out, probably for the best.
Review: no.
Probability of resurrection: 0/10
Conclusion
I’d genuinely forgotten a couple of these until I went through old SQL stored in databases, so it’s been a useful process. By all means take any of the ideas above and run with it (or tell me if you’d desperately like to see it completed). In general I’m happy if you want to replicate anything on the blog as long as you credit me with a little inspiration.
In the meantime, I’ve still got plenty of things sitting in my drafts that I’m actively working on, so I haven’t included those, in the hope that they don’t fall into disrepair also. In fact, I ought to publish this before I forget about it.
Idle Hands
“He’s had nothing to do all game,” we hear, every single week on Match of the Day, as if we’ve just cut to images of Hugo Lloris in a deck chair with a dog-eared copy of War and Peace, startled as a striker thunders by spilling his mojito.
Do keepers really switch off when they’ve had nothing to do? I thought it would be simple enough to check, so I looked at all the shots I have on record in terms of my save difficulty metric.
Methodology
By working out the time between every shot on target faced and the previous goalkeeper event (be it another save, or a goal kick or whatever to wake the keeper out of their trance), you have the number of seconds the keeper has been idle before that shot. I limited the data to shots from open play, as you won’t have the element of surprise from dead-ball situations, and reset the clock at half time, so the maximum time a keeper can be idle is a little north of 45 * 60 = 2700 seconds.
Then to measure keeper over- or under-performance, you can work out the saves above expected for that shot: if a shot has a save difficulty of 70%, we expect a statistically average keeper to only save it 30% of the time. So if they do save it, we’ll score that as 0.7 saves above expected – they got 1 whole save, we expected 0.3 saves (which obviously isn’t actually possible on a single shot, but you get the picture), so they got a profit of 0.7. If they don’t save it, they got a big fat zero saves, and we score it as -0.3.
So, we know for every shot whether the keeper over or under performed when attempting a save (to the extent you believe the outputs of an expected saves model, obviously), and we know how long they’ve been idle. Is there any interesting correlation here? Do higher numbers for idleness result in saves under the expected value?
Results
There is no overall correlation between idleness and shot stopping. I looked at the measure above, along with raw save percentage, with saves grouped into buckets by various lengths of idleness. The chart below shows the save percentage as the green area, and the saves above expected as the line.
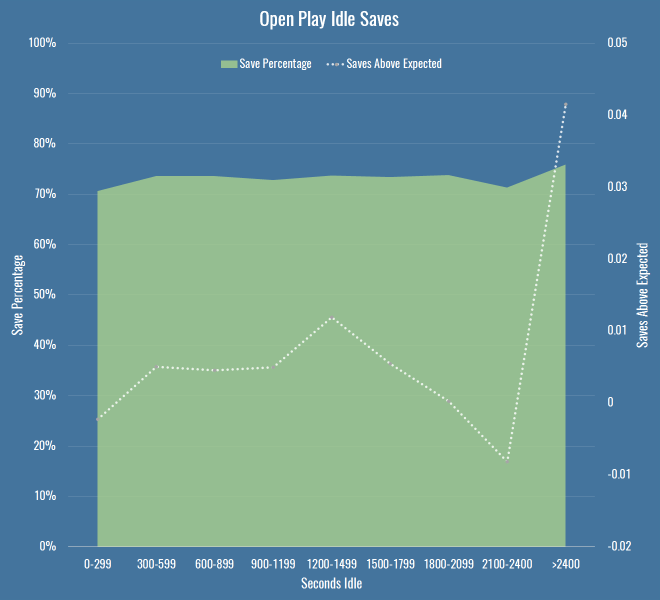
This shows basically nothing – the saves above expected values are tiny, and dwarfed by the error of any particular xG model you choose to use. You can also safely ignore the big jump towards the end of the half – the sample size is miniscule. So, keepers can rest easy against their goalposts?
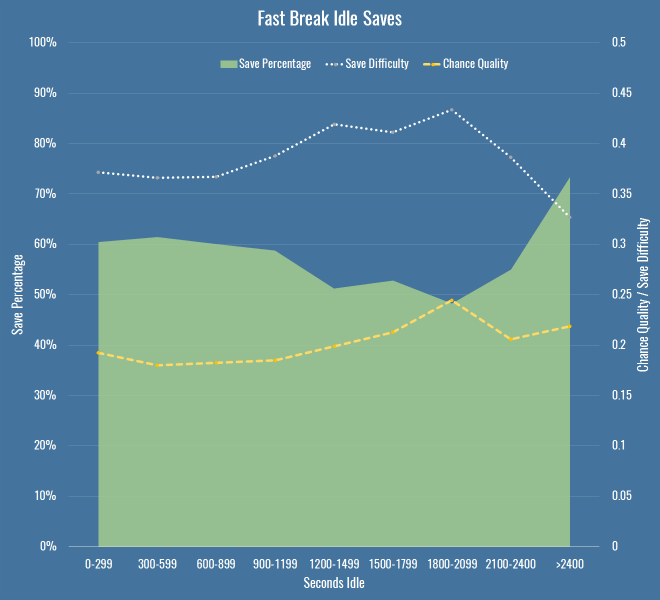
On a hunch I filtered the data down to what Opta deem as ‘fast breaks’. If you’re going to catch an idle keeper off guard, maybe you just need to be quick about it. It’s a smallish dataset (just over 4000 shots) but behold this trend:
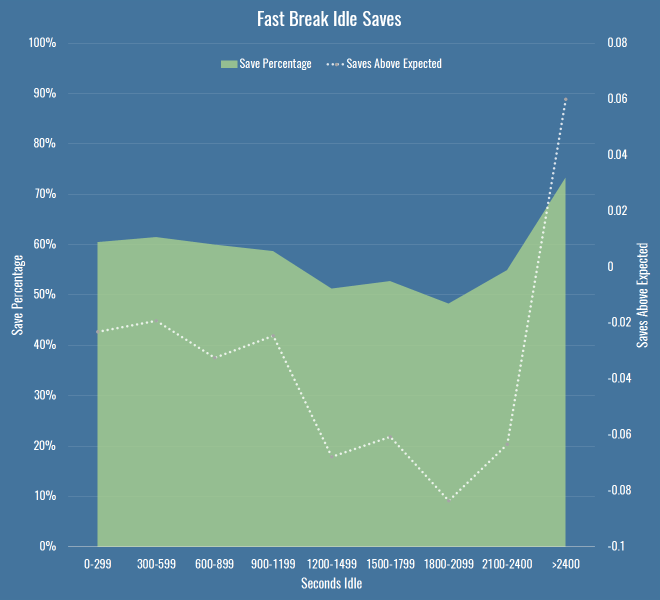
So there you go, have we found something? By the time we’re in that 1200-1499 second bucket, we’re talking 117 shots, with 72 in the next bucket, so again, small sample. I’ve also chosen the bucket size fairly arbitrarily – at 150 seconds per bucket, things are far more chaotic, and we should be wary of Simpson’s paradox when aggregating data. But it does seem to be a hint that maybe something’s going on. There’s at least a 10 percentage point drop in save percentage as idle time increases, and keepers are also saving fewer shots than we expect, which should account for any shot quality issues above and beyond raw save percentage.
Are we sure we have the right cause though? I checked if it was just that teams create better quality chances later into a half (encouraging teams on to them for the first half hour to create counter attacks, or probing and finding weaknesses, I dunno) but saw no real differences per minutes of the half. Then I thought that perhaps it’s nothing to do with keepers at all, maybe defences are the problem. So I created this chart – it shows the same save percentage area as above, but instead of saves over/under expected, I just put the average chance quality and the average save difficulty. This tells us how good the oppositions chances were, and how hard they were to save, regardless of how the keeper dealt with them.
 The important thing to note here is that my chance quality model includes almost nothing about the actual shot as taken by a striker – it’s mostly about the position of the shot, and the buildup to it. For that metric to be going up (again only slightly, and again with a small sample size) it’s entirely possible that the fault doesn’t only lie with idle keepers, but with idle defences too, for allowing better chances. It’s also possible that the under-performance of keepers in terms of expected saves (to the extent we believe it exists) is because we have no measure for defensive pressure.
So what do we know? If there is a decline in performance due to idleness, it’s small, hard to prove with confidence, and may in fact be due to defences and not keepers. Not very convincing, I’m sure you’ll agree, but I was recently reminded how important it was to publish low-significance and null results along with everything else (if only to ease the pressure on the wasteland that is my drafts folder). I also googled around a bit and found nothing mentioning this, so I thought it would be good to get it out there for posterity. At the very least, every time you hear the old cliché in commentary, you’ll know there’s probably little reason to worry that keepers who have been idle will suddenly forget to stop shots.
Caveats
A few notes and avenues for future work if you’re bothered:
- By all means replicate this any way you like, it’s simple enough even if you have public shot data derived from the StatsZone app or BBC live text commentary. I’d be fascinated to hear if you find any patterns I’ve missed.
- I’ve not looked at individual keepers – it’s possible there are some particular keepers that switch off, although I doubt it, and it’ll be a small sample size.
- I didn’t include periods of extra time, just because I wanted to make sure that we were always comparing apple-shaped things.
- I wasn’t strictly measuring idleness as time between saves, I was assuming that a catch or a goal kick was enough to wake a keeper up, but perhaps that’s an assumption to test.
- I’m only looking at shot stopping, so I can’t rule out that idle keepers underperform on interceptions or catches in some way.
- There are other measures one could use for fast breaks, or indeed counters, that may increase the sample size.
